Blog
Reading a Share Price Without the Jargon
What the numbers on a listing page actually tell you
Published 14 March 2025 · 6 min read
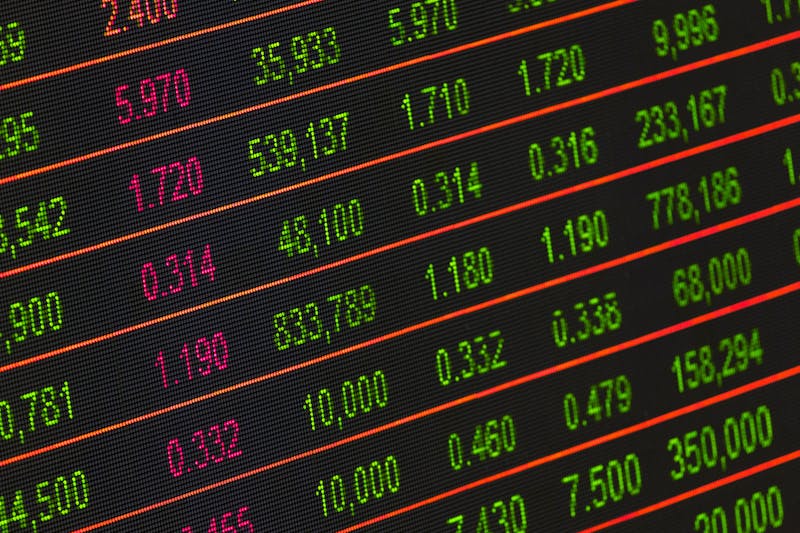
Open any listing page and the first thing that catches your eye is one number, usually printed larger than everything else. That is the last traded price, and on its own it tells you almost nothing. It is simply the figure two people agreed on the last time a share changed hands, which could have been thirty seconds or three hours ago.
Around that headline number sit the parts most first-time readers scroll past. The bid is what buyers are currently offering, the ask is what sellers want, and the gap between them is the spread. A wide spread on a quiet day usually means fewer people are interested right now. The day range shows how far the price moved since the market opened, and volume tells you how many shares actually changed hands to get there.
Here is where beginners get caught. A share priced at a few rand is not automatically cheap, and one priced at several hundred is not automatically expensive. Price per share depends on how many shares a company has issued, not on what the business is worth. A company can split its shares tomorrow and halve the price without changing anything real.
To connect the quote to the business, you need the annual report. Look at revenue, profit, debt and how many shares exist. Divide the market value by the profit and you get a rough sense of what you are paying for each rand the company earns. That comparison is far more useful than the headline figure on the listing page.
Closing exercise
Pick one company you recognise. Write down its last traded price, bid, ask, day range and volume. Then open its latest annual report and note revenue, profit and share count. Try to explain in two sentences why the price is where it is. If you cannot, you have found the gap worth studying next.
Next in the series: Why Inflation Quietly Shrinks a First Salary. For workshop dates and the online cohort, see our sessions.